Digitalization in the metals industry emerged as an industry-wide trend years ago, revealing opportunities for optimization. Through-Process Quality Control (TPQC) from Primetals Technologies has remained a core element in a vision for the ideal digital and automated plant. After several implementations and successes, TPQC has seen recent improvements and new features to transform and optimize plants further toward operational excellence.
A digital knowledge-based software, Through-Process Quality Control (TPQC), provides steel producers with the tools to meet quality standards and optimize production processes. TPQC is the culmination of various integrated automation systems and sensors that collect mass amounts of data to provide actionable feedback to operators, management, quality engineers, and technologists. The automated and optimized plant is part of operational excellence, a concept that sets steel plants apart through digital solutions.
From Data Collection to High-Quality Results
At its core, TPQC is a data collection and analysis tool that aggregates key figures and statistics in every part of the production process. The key “through-process” integration of TPQC captures high-quality data from valuable data points. These data points create a product genealogy providing insight into signal details, heatmaps, and product- and signal comparisons visualized in different dashboards.
These data collection features combine into the evaluation of quality and execution of corrective measures. Once quality rules are set following the analysis of the collected data, alerts are created when real-time deviations occur. Furthermore, prediction models reveal correlations and patterns between input variables and the target product properties and signal when there has been a deviation from the rules. These alerts also provide recommendations on compensating for deviations and correcting the root causes with corrective measures. Above all, the system supports product disposition and release to handle quality-related issues, ensuring the highest quality is continuously maintained.
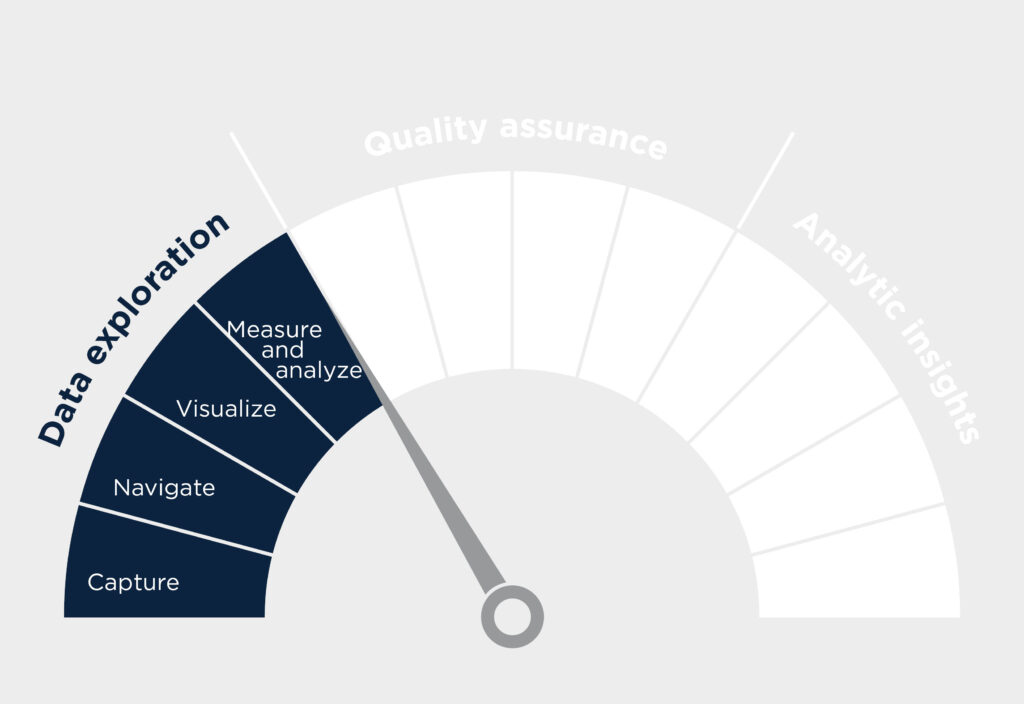
Data Exploration – Understanding the past
- Capture signals relevant to products and processes—the digital product twin
- Navigate the digital product twin to develop a product genealogy
- Visualize detailed information and compare products and similar production units using charts, tables, heatmaps, histogram charts, or dashboards comparing signals
- Measure business performance according to Key Performance Indicators
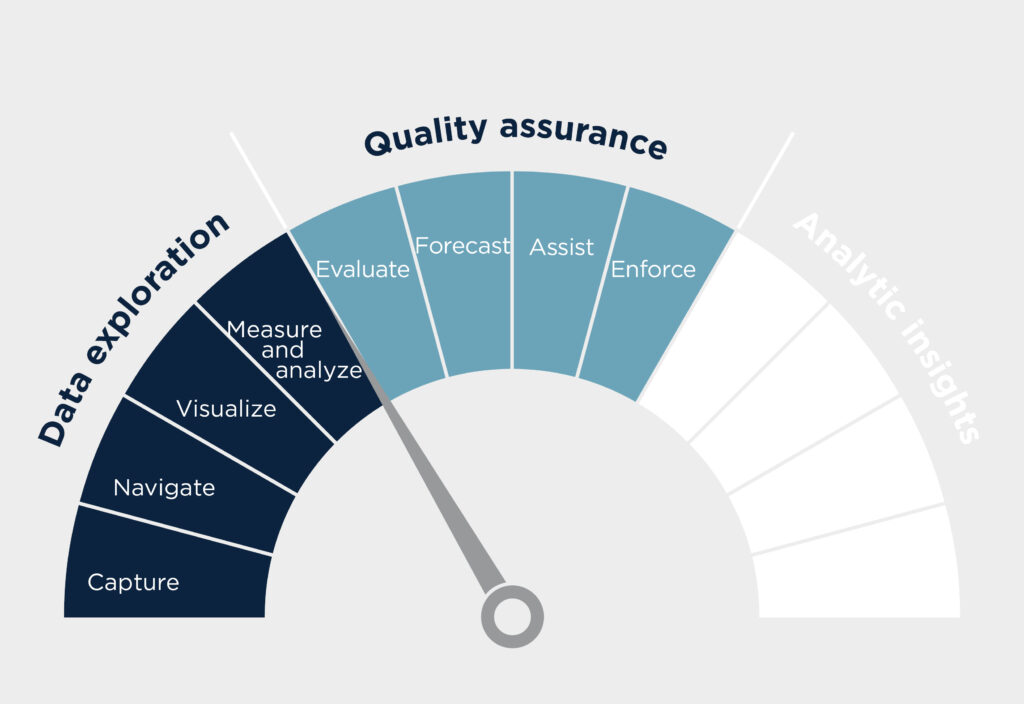
Quality Assurance – Control, evaluate, and enforce
- Online evaluation of ongoing order execution
- Forecast alarms based on real-time prediction at intermediate production steps.
- Assist via root cause analysis and recommendations
- Enforce product quality via integrated process optimization measures
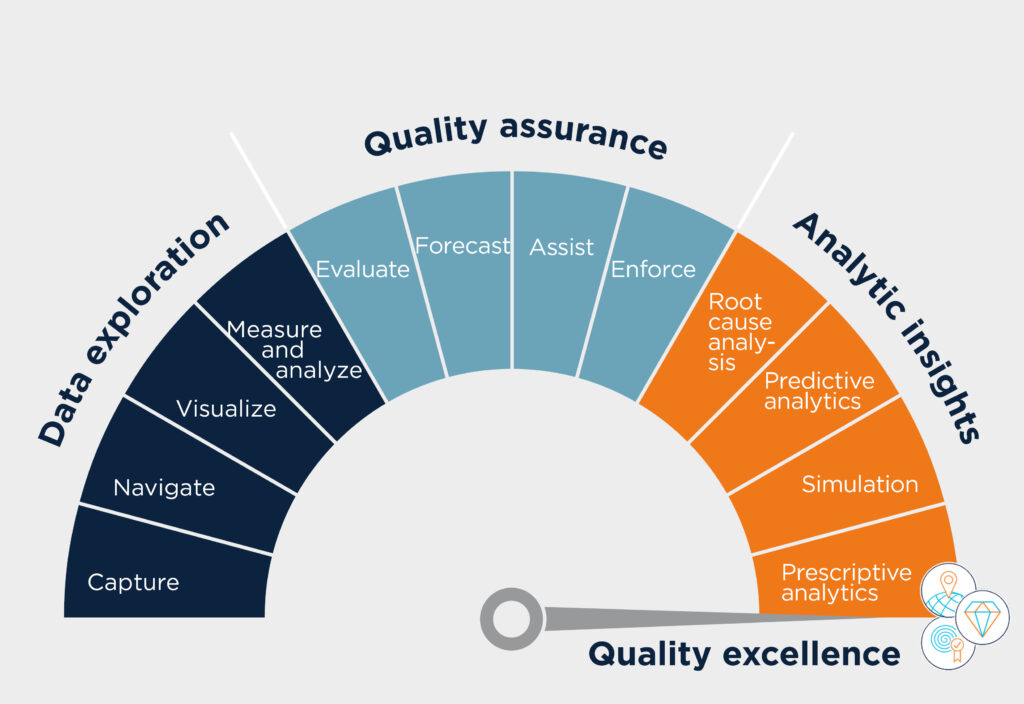
Analytics and Insights – Learn from data
- Reveal undetected root causes of defects
- Prediction of product properties to accelerate reaction time on deviations.
- Simulate to evaluate the impact of changes via virtual product development
- Prescriptive analysis delivers optimized process parameters.
Making Quality Visible
Another crucial feature of TPQC is visualizing product signals at various times or positions throughout the production chain, including heat maps to display signal and surface defects when analyzing vast amounts of data. Visualization allows users to overlay signals—e.g., continuous casting mold level and finishing mill exit temperature. A new feature of these visualizations is the ability to view data of a selected product in the context of other related products—e.g., data from one product compared to other products on the same tundish. Defects can thus be identified with an area with a common point in the production process. For example, coils with defects may have all been produced during the same caster sequence or hot strip mill work roll campaign. Visualizing these coils on the running order of the production unit can provide insights into how, when, and why a defect occurred.
Visualizations of products from specific campaigns
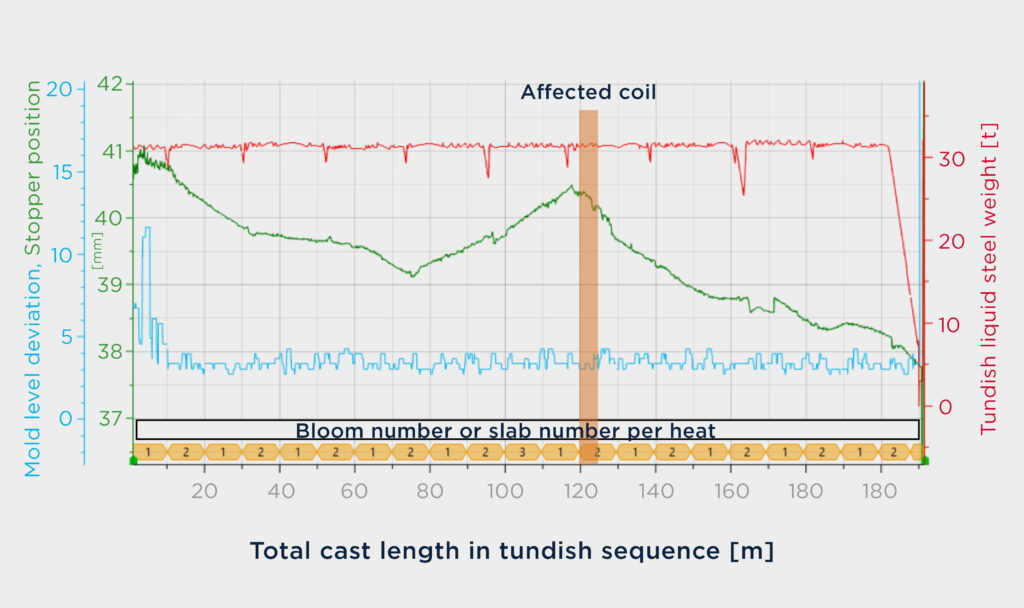
A new chart reveals the tundish sequence at a slab caster or a work roll change campaign at a hot strip mill to reveal a collection of position data across the entire length produced. Specific events can be analyzed for a tundish sequence, such as the caster tundish stopper position, mold level deviation, and the steel weight in the tundish. The projection feature of TPQC allows downstream signals to point back to the caster sequence and trace the final defects to a specific position within the casting sequence.
Visualizations of related products
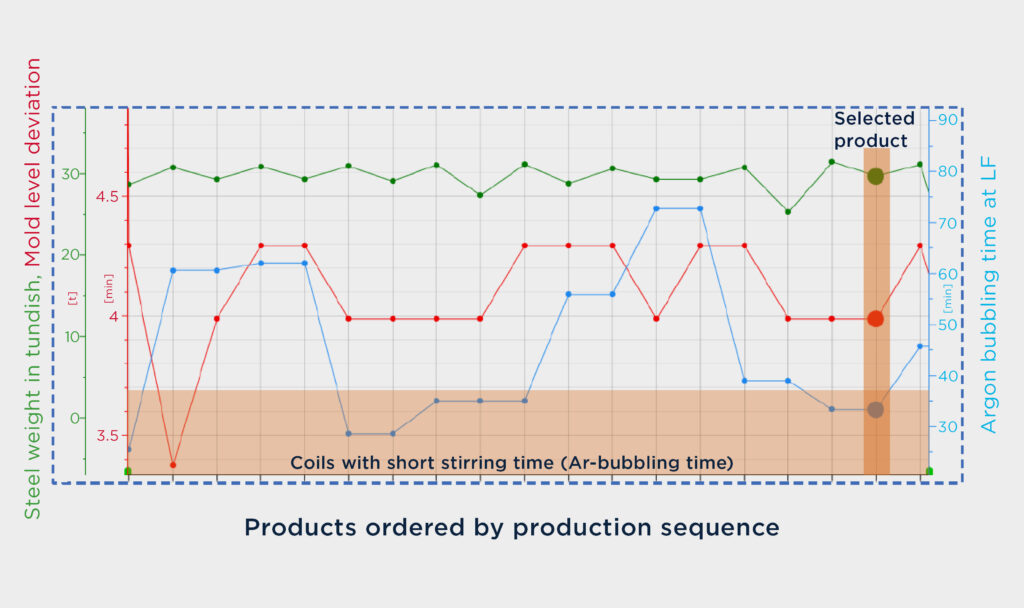
This chart allows users to identify a specific criterion—e.g., heat, caster sequence, work roll campaign—and all products that share this similar criterion can be visualized on the same chart. Examples include comparing heats from the same tundish sequence, showing products from the first or last ladle in a sequence, displaying all products from the same work roll campaign at a hot strip mill, and showing all products produced with the same skin pass mill work roll.
Visualization of histogram charts
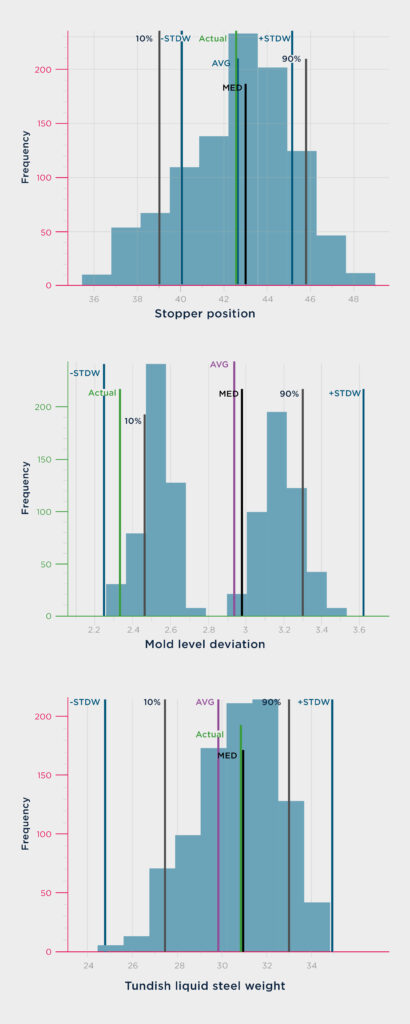
The histogram chart feature allows users to quickly visualize signals for products sharing a common filter criterion, helping to identify patterns in signal distribution. The value measured for the selected product is indicated in the histogram revealing its relation to the overall distribution. The function allows for multiple visualization dimensions in one layout with advanced filter and aggregation options resulting in new insights, making TPQC data exploration even more powerful.
Predicting Quality
From the vast amount of data collected, the conclusions that TPQC can draw are powered by data analytics concepts. Methods from Primetals Technologies look at statistics reports and business intelligence, followed by diagnostics and prediction of mechanical properties (Quality Guard) and virtual optimization (Quality Lab). Beyond these methods, prescriptive optimization is crucial to increasing revenue, improving efficiency, and boosting business performance. TPQC connects to an AI framework enabling model training and updates for data-based root cause analysis and predictive and prescriptive models. Using artificial intelligence, new insights, and root cause identification provides previously unidentified correlations. Prediction models are also trained using the data collected and implemented in TPQC to forecast production.
Quality Guard connects to the data from the TPQC database to predict and analyze mechanical properties. Quality Lab is an off-line virtual simulation tool operating independently from daily production and utilizing historical data. As a virtual optimization tool, product development, quality, and production engineers can investigate the impact of changes in production parameters. In virtual product development, producers can view the impact of various changes offline and anticipate any changes to production. The process parameters can also be set by prescriptive models and utilized in Level 2 automation systems for new products.
Prescriptive Process Optimization
Beyond these steps, process parameters can be set by prescriptive models and utilized in Level 2 automation systems for new products and to optimize production even further. Prescriptive analytics improve process stability regarding product properties, tighter tolerances, and higher quality. Data models look for viable possibilities to compensate for property deviations by adapting parameters, increasing qualified rates, reducing downgrading, lessening compensation costs, and lowering risks in serial production.
Introducing Statistical Process Control (SPC)
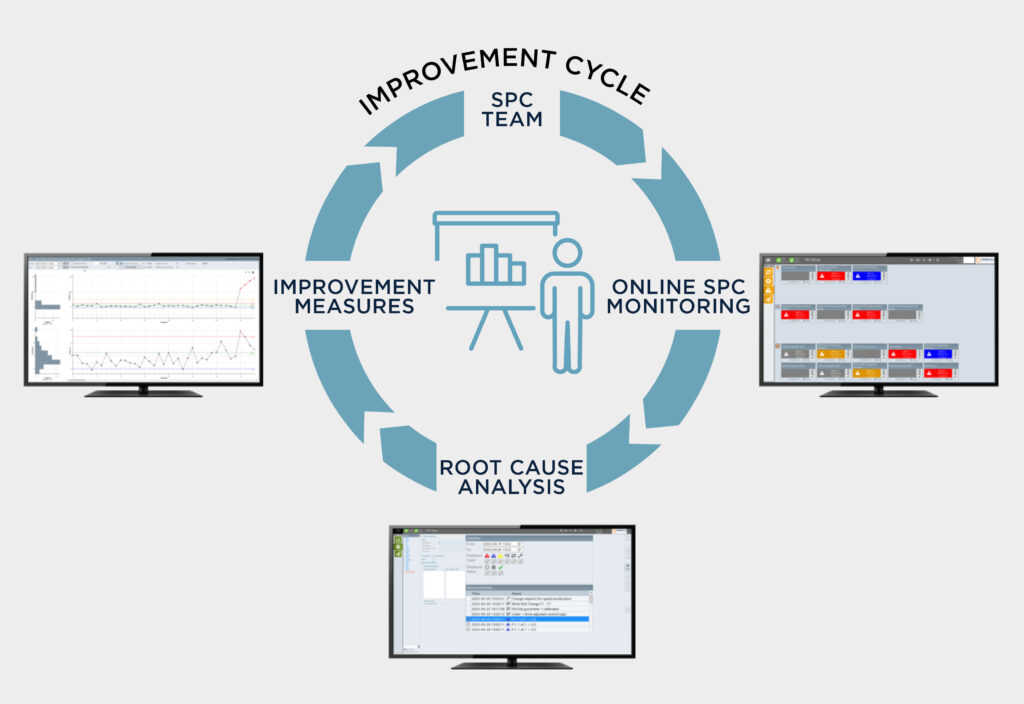
TPQC features continuous improvements and optimization opportunities for steel plants, but TPQC itself has also undergone its own set of improvements after implementation at several plants. Statistical Process Control (SPC) has been introduced as a quality control technique to monitor and control processes to ensure consistent and efficient operation. SPC collects and analyzes data to detect changes in the process that could impact quality. SPC identifies root causes of process variations, facilitating improvements in product quality. When corrective action is taken, those actions are documented and monitored for effectiveness.
SPC integrates corrective actions, root cause identification, and implementing corrective measures to monitor their effectiveness or improvements. Alarms are targeted to the responsible team members to set specific actions and enter new root causes into the system. For some standards and certifications of end products, event logs are also mandatory. These logs—a collection of actions, including alarms, root causes, and corrective actions—record all quality-related occurrences. These event logs also help trace issues more effectively. Thus, SPC brings its analysis together with event logs to produce even more valuable insight into the process, identifying potential problems earlier and supporting further improvement efforts. SPC creates a new improvement cycle, covering evaluation, forecasting, and assistance functions, taking TPQC even further regarding operational excellence.
MORE INFORMATION
Click here to learn more about how the steel industry is embracing Industry 4.0 and digitalization.